Publisher Statistics — Revenue, RPM, and What to Optimize
Your placements are live and impressions are flowing. Now it's time to understand what the numbers mean and where to find optimization opportunities. This guide walks through the publisher statistics dashboard.
The Revenue Chart
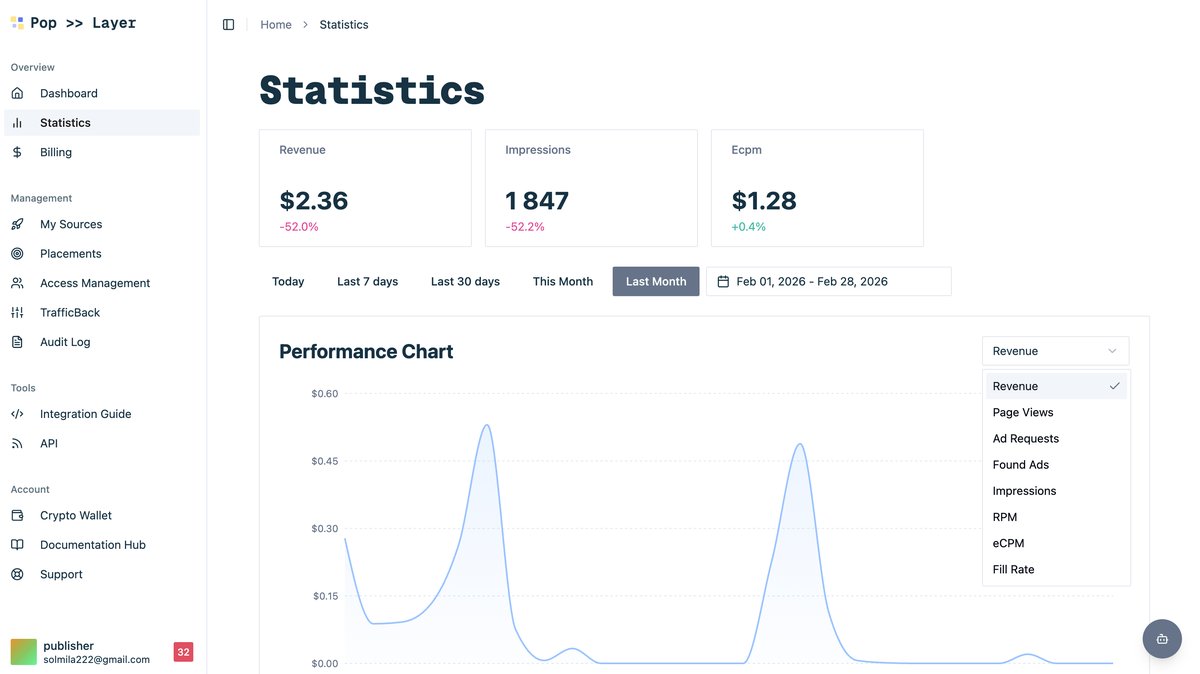
The chart at the top of Publisher Statistics plots your daily earnings alongside impression volume. Toggle between Revenue, Impressions, RPM (revenue per mille), and other metrics using the controls above the chart.

Choosing the Right Metric
Click the metric dropdown to switch what the chart displays. Key metrics to monitor:
- Revenue — total earnings (what hits your wallet)
- Impressions — raw volume
- RPM — revenue per 1,000 impressions (your effective monetization rate)
- Fill Rate — percentage of ad requests that got a bid
The Detailed Report
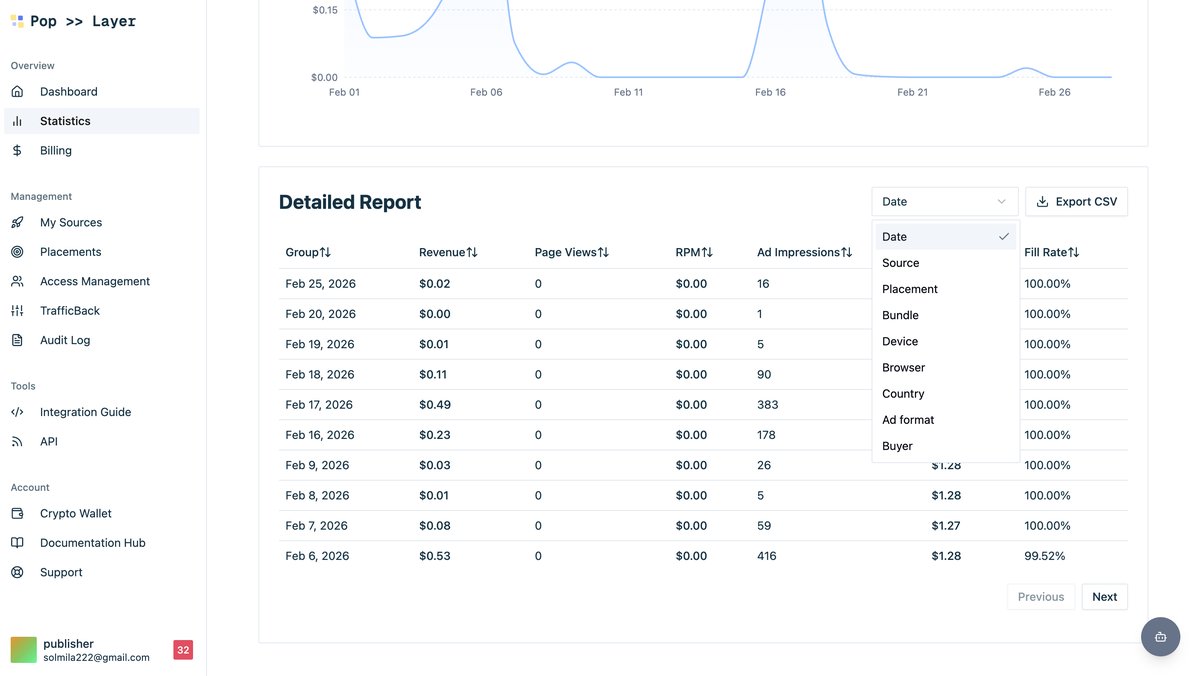
Below the chart, the Detailed Report table lets you slice data by source, placement, geo, device, or any combination. Use Group By to pivot, and click column headers to sort.
Setting Floor CPMs for Maximum Revenue
Floor CPMs are the single most impactful optimization lever for publishers. Set them too high and you lose fill rate; set them too low and you leave money on the table. Here's a practical approach:
- Group your stats by GEO and note the average CPM per country.
- Set floor CPMs at roughly 70–80 % of the average winning bid for each geo.
- Monitor fill rate for a week — if it drops below 60 %, lower the floor slightly.
- Re-evaluate monthly as buyer demand shifts seasonally.
Key Takeaways
- RPM > Revenue for optimization decisions — it accounts for volume changes.
- Group By GEO is your best friend — CPMs vary 10x between countries.
- Floor CPMs should be per-geo, not a single global number.
- Check weekly — the ad market is dynamic and what worked last month may not work today.
Next: learn how to earn passive commissions by referring other publishers in "How to Earn Commissions as a Referral Agent."